How Drone Thermography Catches Solar Panel Faults Before They Cost You Money
By Vibhawa Editorial Team · Vibhawa Consultants
Key takeaways
- Inverter and string monitoring tells you output has dropped, not which module or connector is responsible. Thermography shows where.
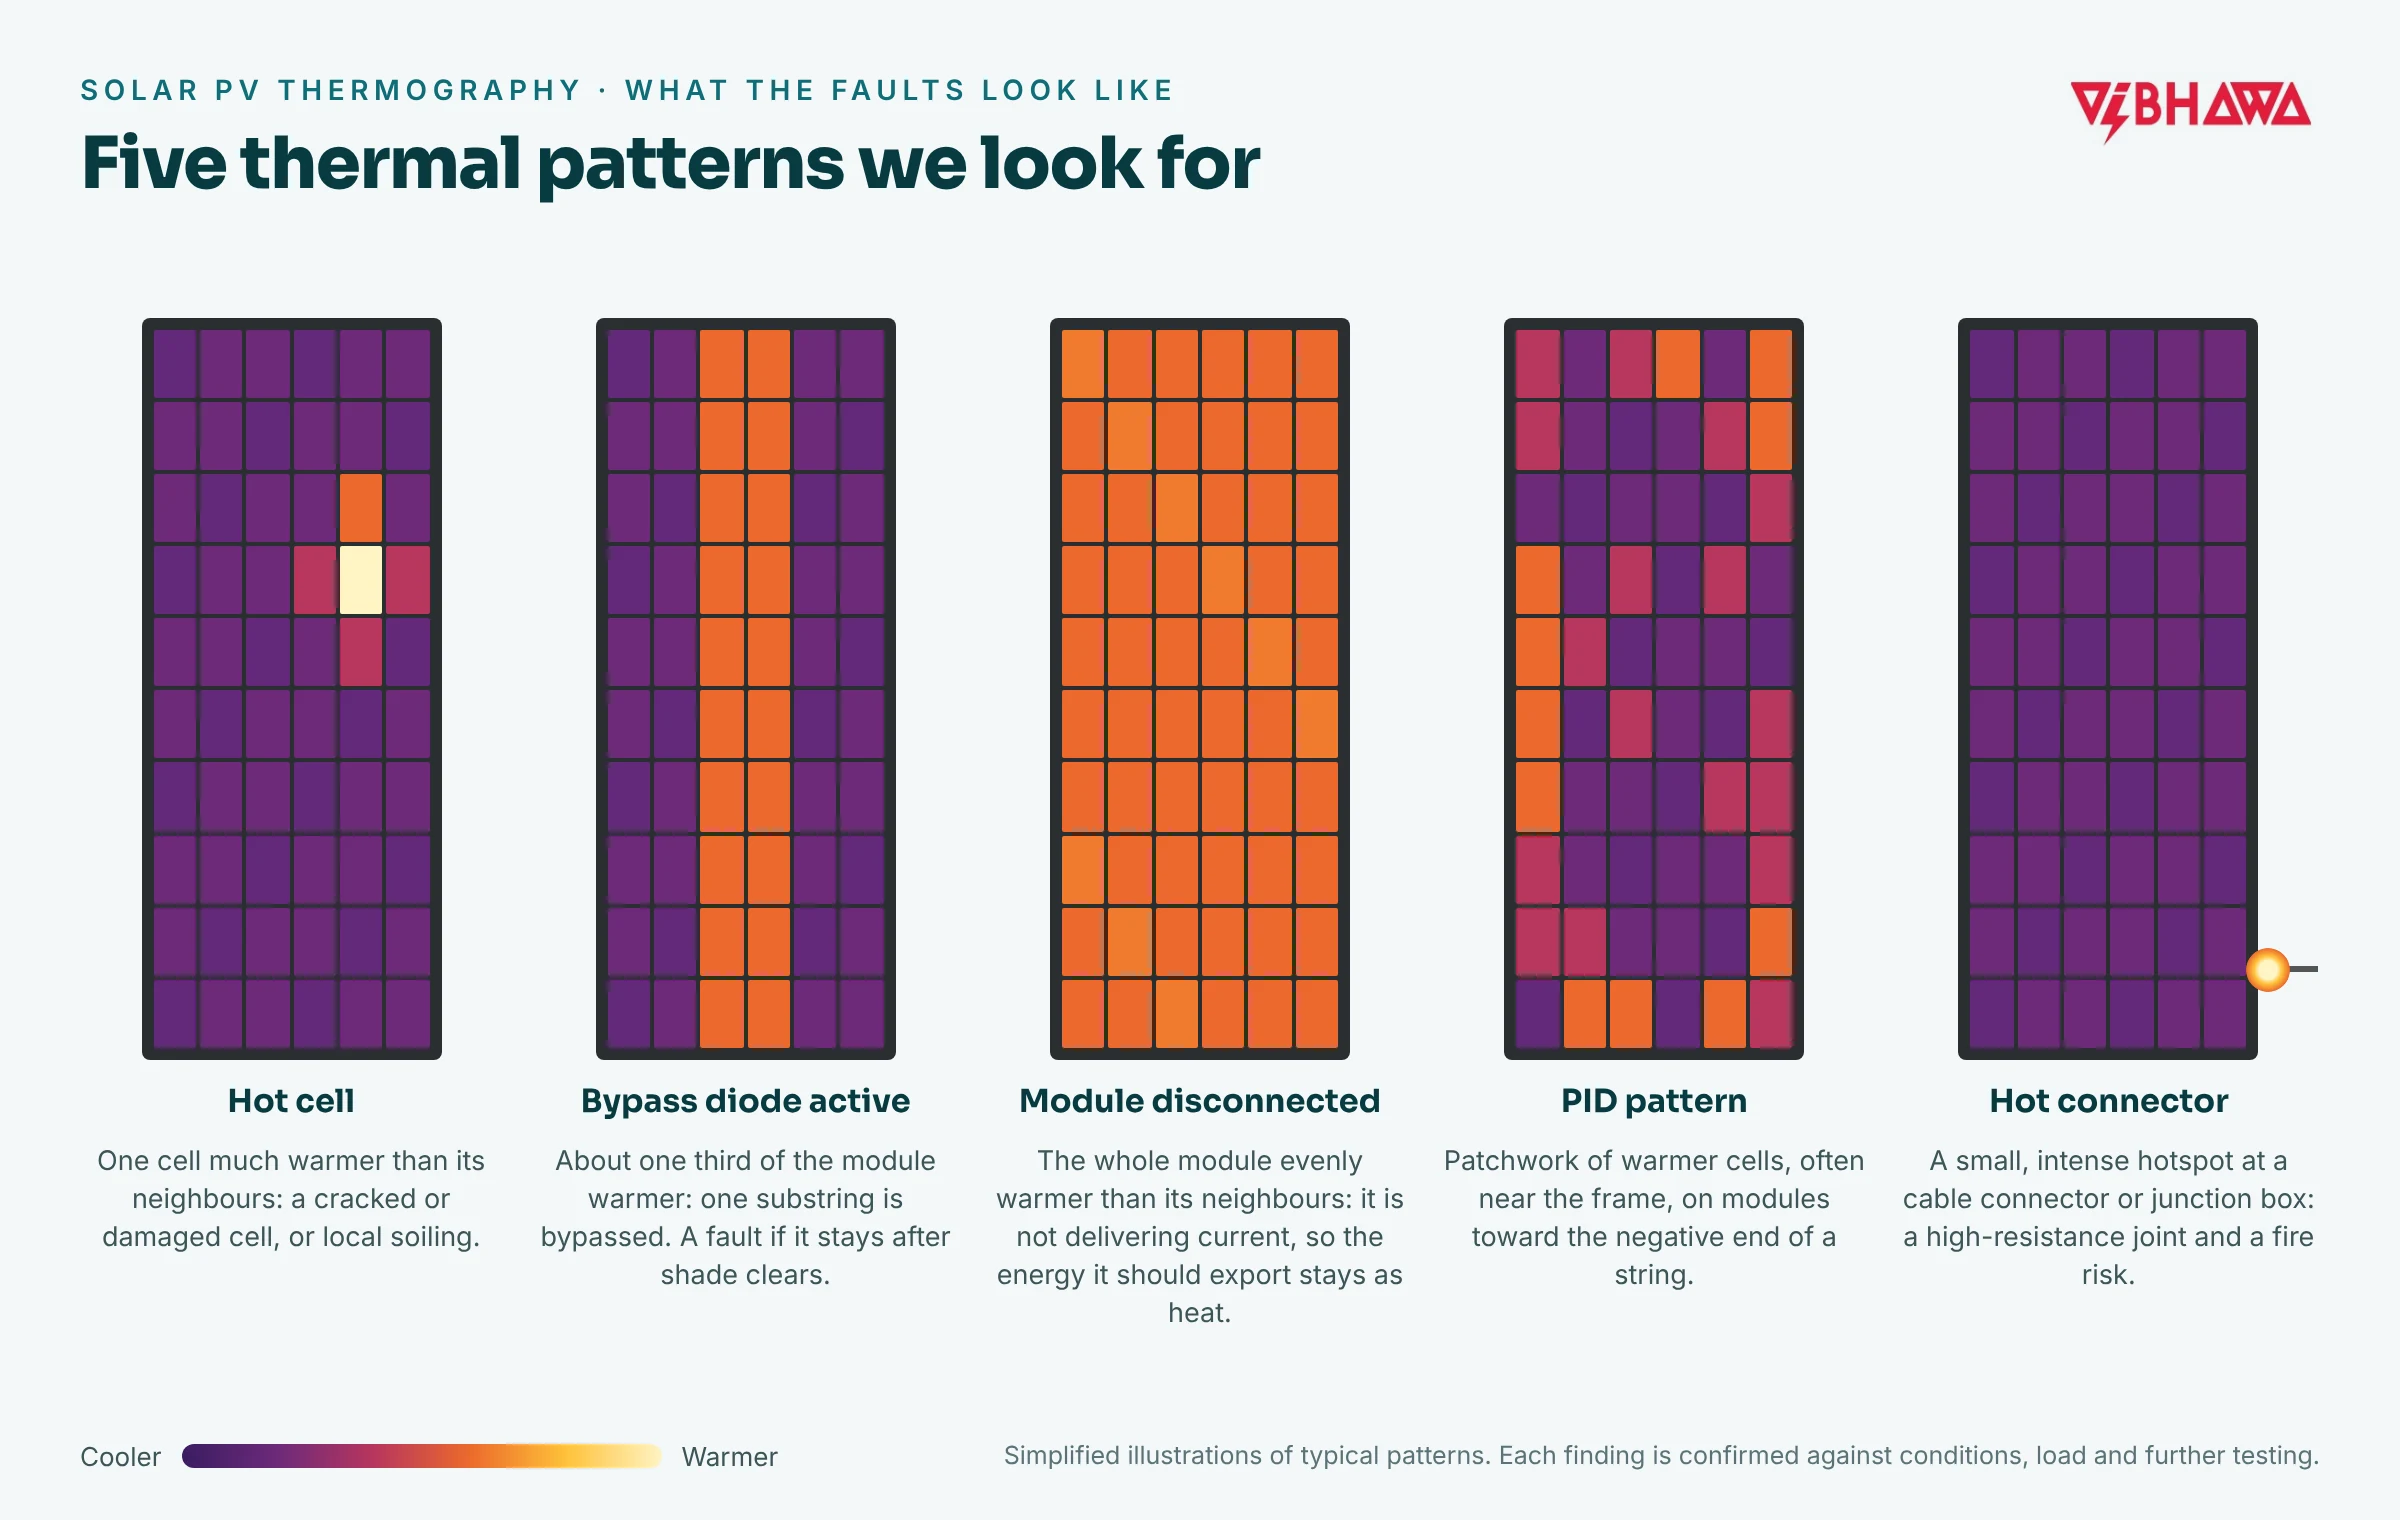
- Five patterns cover most findings: hot cells, active bypass diodes, disconnected modules or strings, PID patterns, and hot connectors.
- A disconnected module or string shows up warmer, not cooler, because the energy it should export stays as heat.
- Surveys should follow IEC TS 62446-3: steady sunshine of at least 600 W/m², enough resolution to see individual cells, and a classified anomaly report.
- Vibhawa has surveyed rooftop solar PV at Piramal Glass and Ansell Lanka, with every survey analysed by an in-house certified thermographer.
Why solar PV faults go unnoticed
Most PV monitoring works at the inverter or string level. It tells you that production is lower than expected, but not why or where. One underperforming module, or a single damaged cell, can hide inside a string’s numbers for months, especially on a large roof where output already varies with shade and soiling.
A visual walk-round catches broken glass and obvious damage. It does not catch the electrical faults, because those show no visible symptom. They do show as temperature, which is why thermography works: wherever current is blocked or meets resistance, the module or connection heats up.
What each solar panel fault looks like in a thermal image
| Fault | Typical cause | Thermal pattern | What we recommend next |
|---|---|---|---|
| Hot cell or hotspot | Cracked or damaged cell, delamination, local soiling or bird droppings | One cell, or a small area, much warmer than the cells around it | Check for soiling; confirm damage with a close visual or ground-level image; replace the module if the cell is damaged |
| Bypass diode active | Part of the module is shaded or impaired, so its substring is bypassed | About one third of the module evenly warmer (on a typical three-substring module) | Recheck once shade has cleared. If it persists, test the diode and the junction box |
| Module or string disconnected | Open connector, failed cable, blown string fuse or tripped string | The whole module, or a full row of modules, evenly warmer than its neighbours | Trace the circuit and repair; compare string currents at the combiner box |
| PID pattern | Potential-induced degradation from voltage stress between cells and the frame, worse in heat and humidity | A patchwork of warmer cells, often near the frame, on modules toward the negative end of a string | Confirm with I–V curve tracing or electroluminescence; check inverter grounding; consider PID recovery equipment |
| Hot connector or junction box | Loose, corroded or mismatched connector; overheating junction box | A small, intense hotspot at a cable joint or the back of a module | Repair promptly. This is a fire risk as well as a loss |
A warm pattern is a lead, not a diagnosis. The thermographer weighs it against irradiance, ambient temperature, wind and the module’s position in the string before deciding what it most likely is and how urgent it is.
How these faults cost you money
Every module that is not producing is energy you have already paid for and are not getting back. As a rough guide, assuming about 1,400 kWh per kWp per year, which is typical for Sri Lanka:
- One 550 W module offline loses roughly 770 kWh a year.
- A string of 20 such modules offline loses roughly 15,000 kWh a year, for as long as nobody notices.
The cost does not stop at lost production:
- Hot cells age faster and can damage the backsheet and encapsulant over time.
- PID spreads gradually across a string and is often mistaken for normal ageing, by which time the loss is large.
- Hot connectors are a genuine fire risk, which matters most on a factory or warehouse roof.
- Undocumented defects are harder to claim under module or installer warranties. A dated thermal report is evidence.
How a proper survey is done: IEC TS 62446-3
IEC TS 62446-3 is the IEC technical specification for outdoor infrared thermography of PV modules and plants. It turns a set of thermal photos into a survey you can act on. The points that matter most:
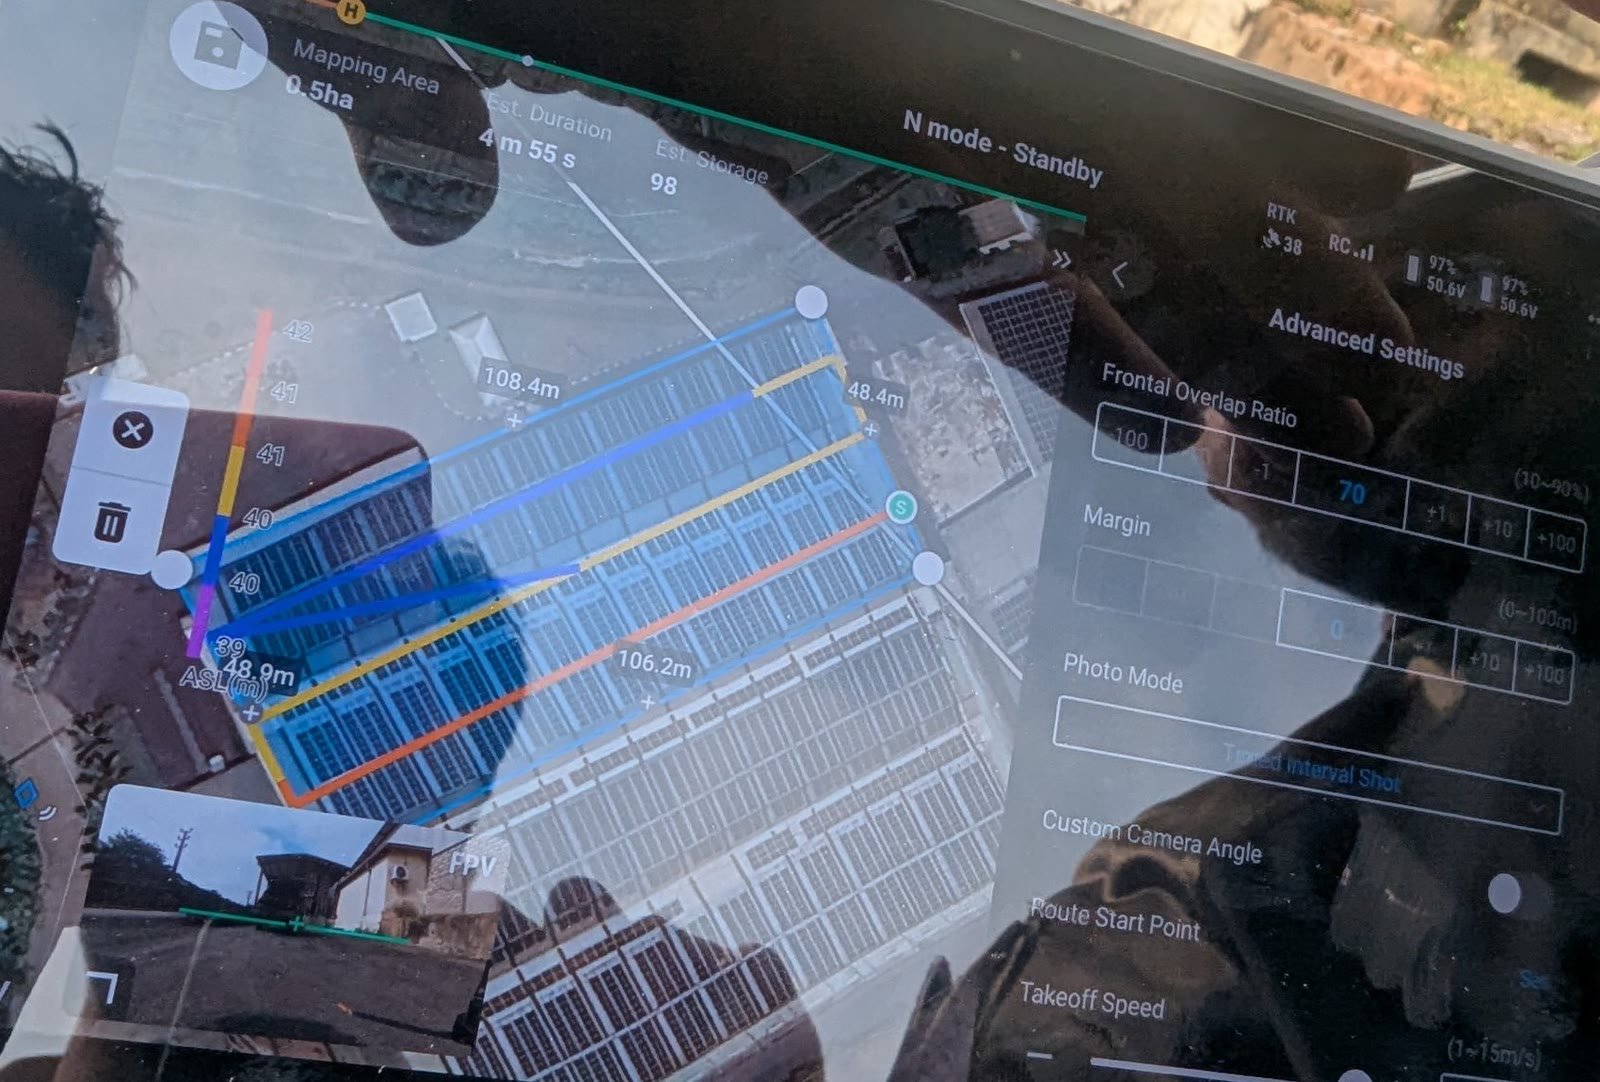
Our solar PV thermography work
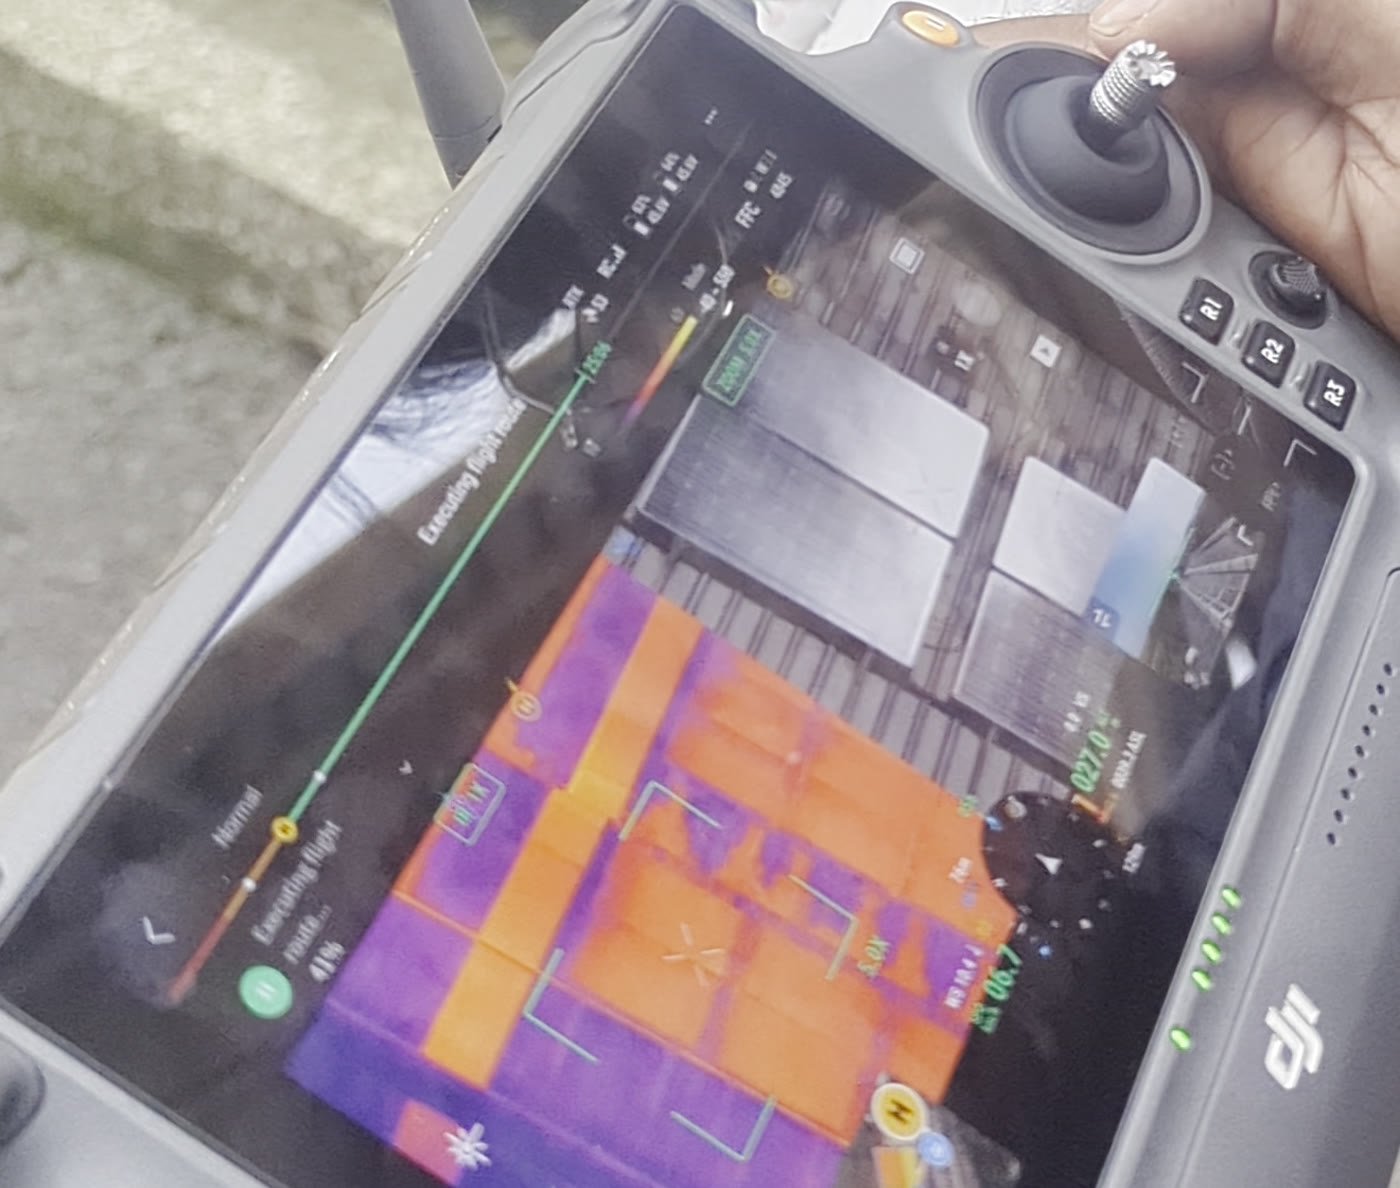
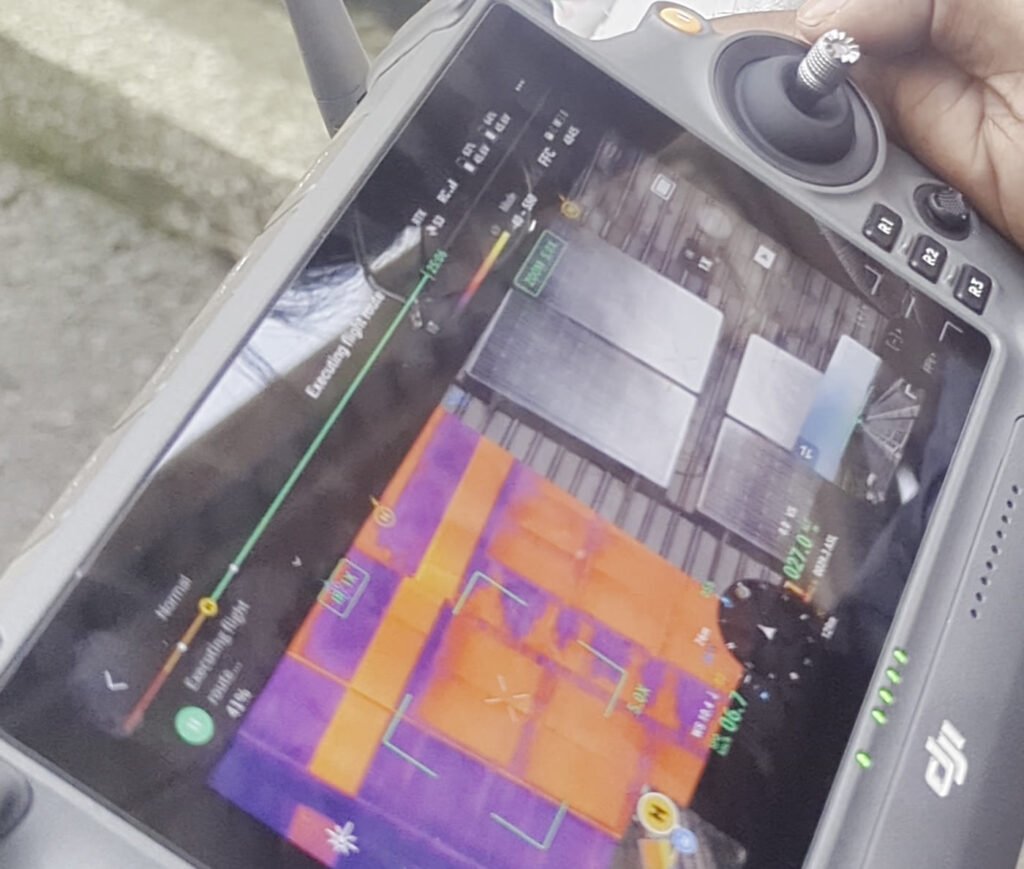
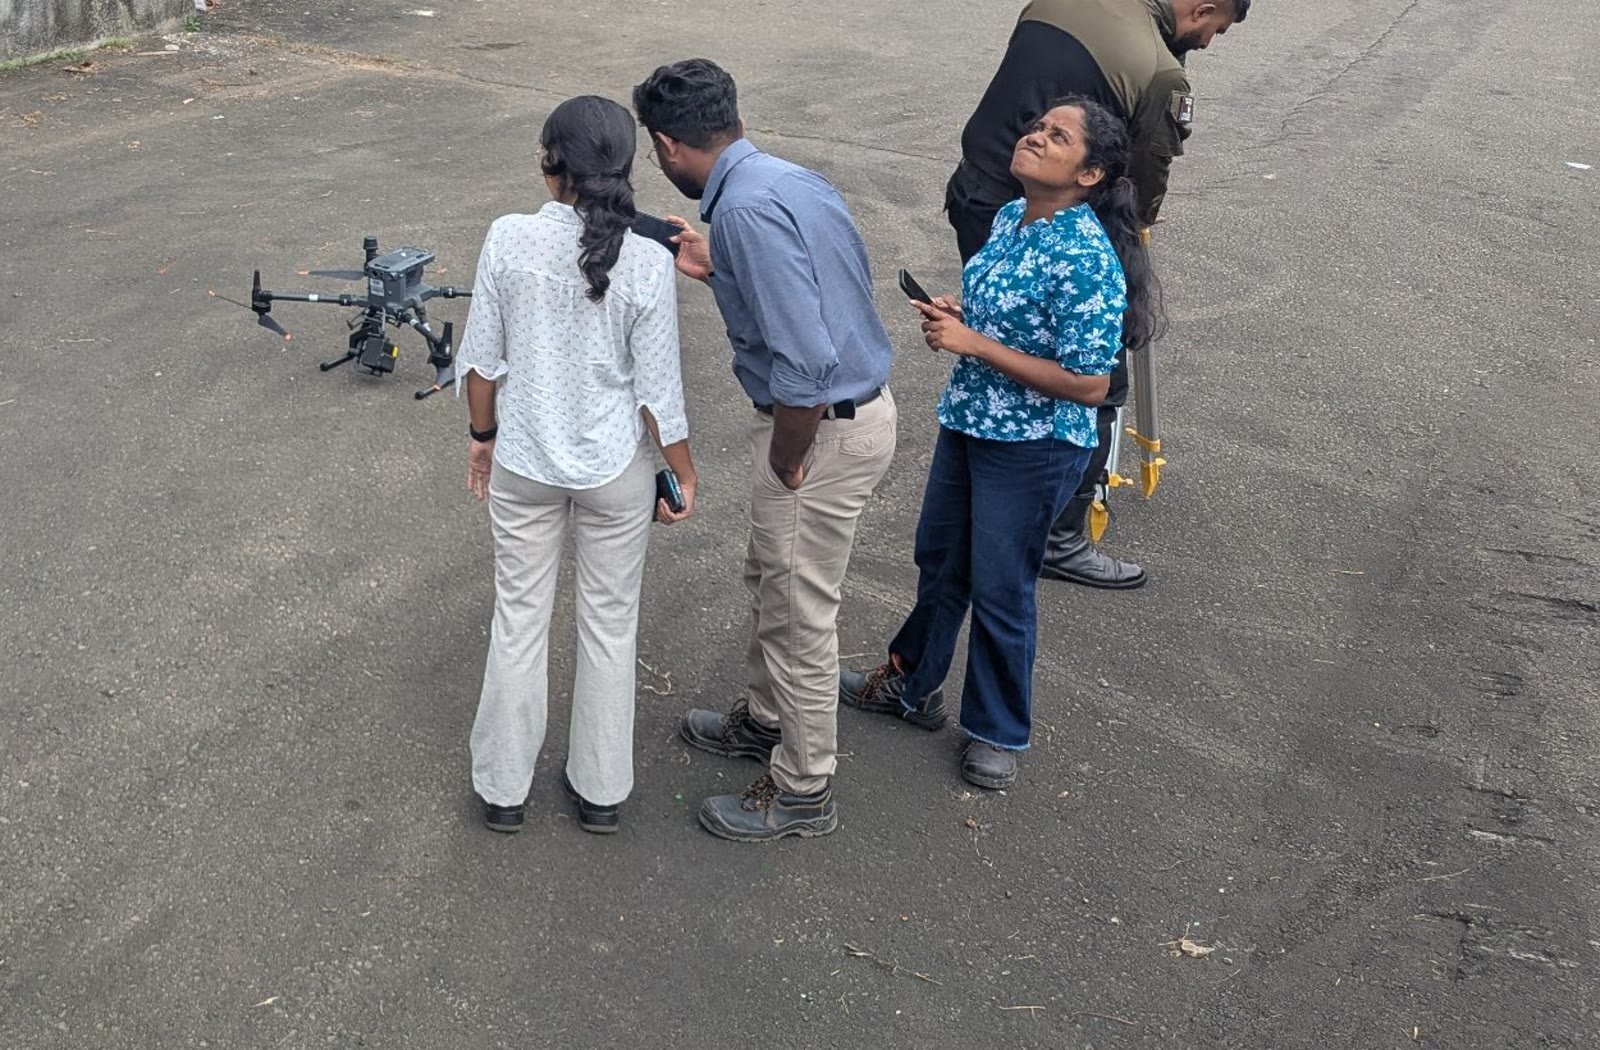
As a guide to scale, a few megawatts of rooftop PV is about half a day on site. We fly the DJI Matrice 350 RTK with the Zenmuse H20T and the newly added DJI Matrice 4T, and choose the aircraft for the site.
Drone or ground-based thermography?
A drone survey is the fastest way to screen a whole array and find the modules that need attention. It does not replace every other test. Depending on what the survey finds, the next step may be a closer ground-level thermal image, I–V curve tracing of a string, or electroluminescence imaging to confirm PID or cell cracks. For inverters, combiner boxes and switchboards, ground-based thermography is the right tool; see our specialist arm, thermography.lk. For a full check of system performance, see our Solar Health Check.
When to survey your solar PV system
- Soon after commissioning, to record a baseline and catch installation defects while the installer is still responsible
- Before the installer’s workmanship warranty or a module warranty claim deadline
- When monitoring shows an output drop you cannot explain
- After a severe storm, lightning activity or roof works
- Every year as part of planned maintenance, so each survey can be compared with the last
Book a solar PV thermography survey
Tell us the site, the system size and what your monitoring shows. We’ll plan the flight and send you a quote.
For our full aerial service, see aerial thermography for solar PV and substations.
Frequently asked questions
What is solar panel drone thermography?
It is a survey of operating solar PV modules with a thermal camera on a drone. Faults such as damaged cells, bypassed substrings, disconnected modules and failing connectors run hotter than healthy modules, so they show up in the thermal image even when nothing is visible to the eye.
What faults can drone thermography find on solar panels?
Hot cells and hotspots, active or failed bypass diodes, disconnected modules and strings, potential-induced degradation (PID) patterns, and overheating connectors and junction boxes. Each has a different thermal pattern, and a certified thermographer confirms the likely cause.
Does a disconnected solar string look cooler or hotter in a thermal image?
Hotter. A module that is not delivering current cannot export the energy it absorbs, so it heats up and appears evenly warmer than the working modules around it. A whole string that is open-circuited shows as a row of uniformly warm modules.
What standard applies to solar PV thermography?
IEC TS 62446-3, the IEC technical specification for outdoor infrared thermography of photovoltaic modules and plants. It sets the minimum irradiance (at least 600 W/m²), the measurement conditions, the image resolution, how anomalies are classified, and what the report must contain.
How long does a drone solar PV thermography survey take?
For rooftop systems, a few megawatts of PV is typically about half a day on site, depending on access, layout and weather. The analysis and report follow after the flight.