
June 25, 2026

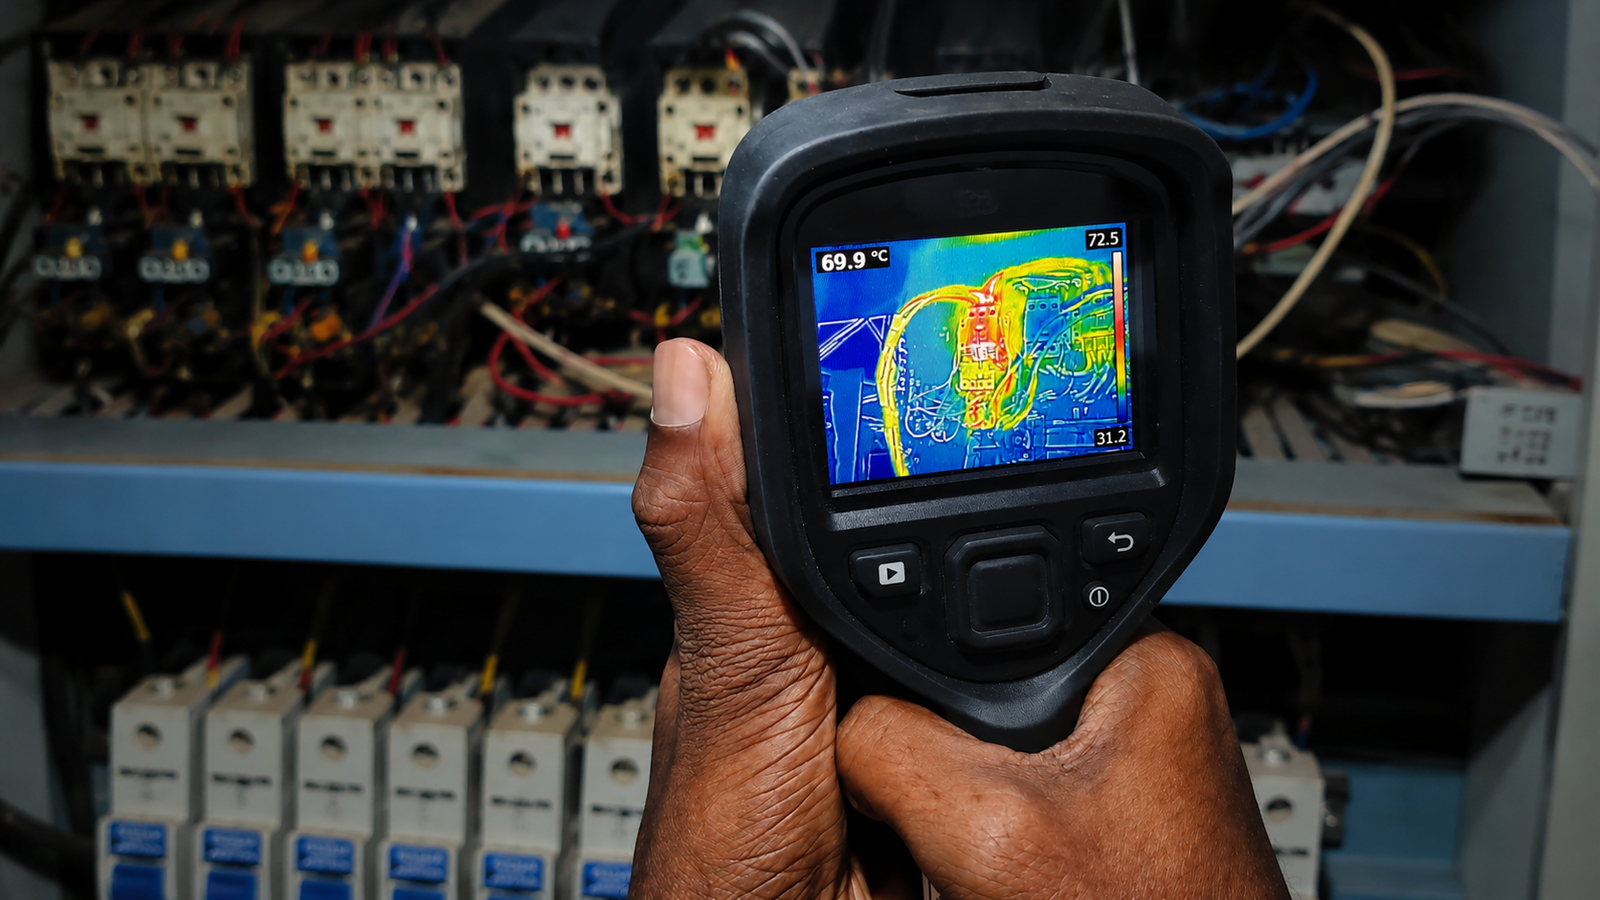
Almost every electrical fault announces itself as heat before it announces itself as a failure. A thermal camera on a drone finds that heat across a whole array or switchyard in a morning, under load, without anyone approaching live equipment.
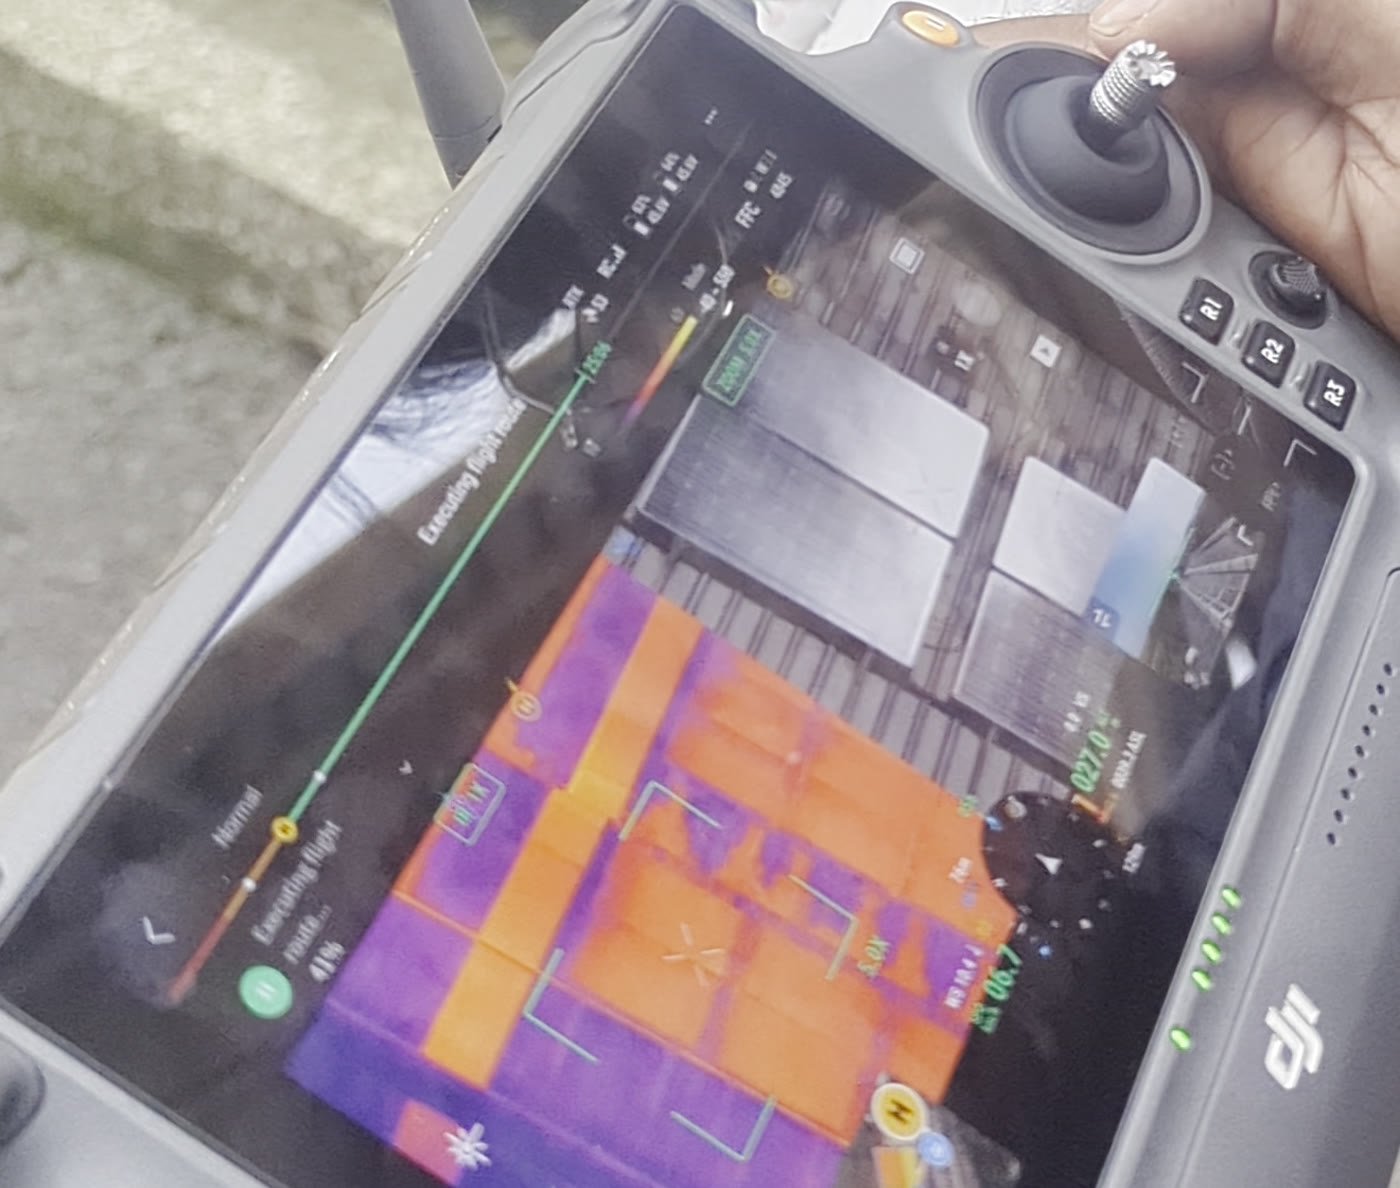
Radiometric thermal of a rooftop array, live on the controller. Orange is warm, purple is cool — and the number in the corner is a measured temperature, not a colour guess.
the standard that matches the asset
sub-module detail on a solar array
no outage, no exclusion zone
every anomaly ranked by severity
A loose busbar joint, a degraded crimp, a cracked solar cell and a failing bypass diode have one thing in common: resistance where there should be none. Resistance turns current into heat, and the heat shows up long before output drops, a breaker trips or anything is visible to the eye.
That makes thermography the earliest honest warning you can get from an energised system — but only if someone reads it properly. A warm panel at noon might be a fault or it might be the sun. Telling the difference needs the load at the time, the ambient conditions, the emissivity of the surface and knowledge of how that asset fails. That judgement is the service; the drone is how we reach the asset.
String-level monitoring tells you production has dropped. It does not tell you which of several thousand modules is responsible. An aerial thermal survey does, module by module, in a fraction of the time a hand-held walk would take.
Cell and sub-module hotspots
cracking, shading damage, mismatch
Bypass diode activation
a third of a module at a different temperature
PID signatures
flagged for confirmation, never diagnosed from heat alone
String and connector faults
including strings running cool because they are offline
Standard: IEC TS 62446-3, the technical specification for outdoor infrared thermography of photovoltaic modules and plants in operation. It governs the conditions, the equipment and how an anomaly is classified — which is what makes one survey comparable with the next.
Delivered: a 2 MW rooftop array at Piramal Glass, Horana, and three further rooftop arrays at a manufacturing site in Biyagama. See the Piramal survey.
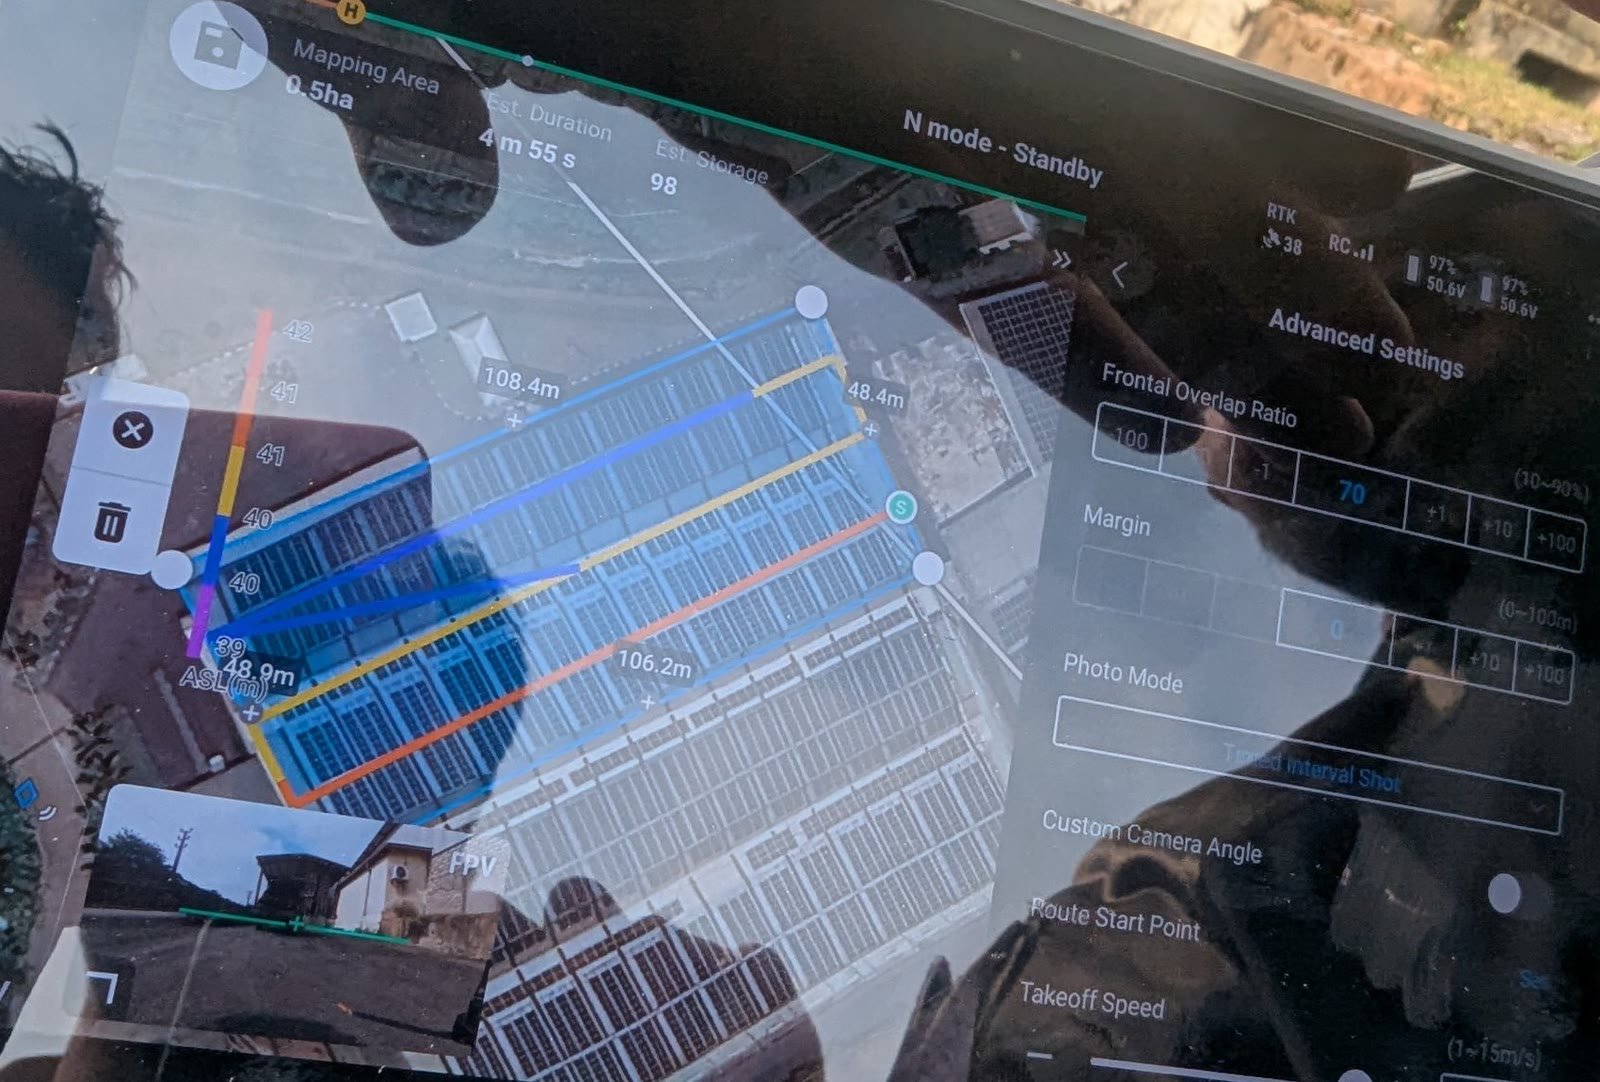
Flight lines are planned for consistent overlap and altitude, so the same array can be re-flown identically next year.
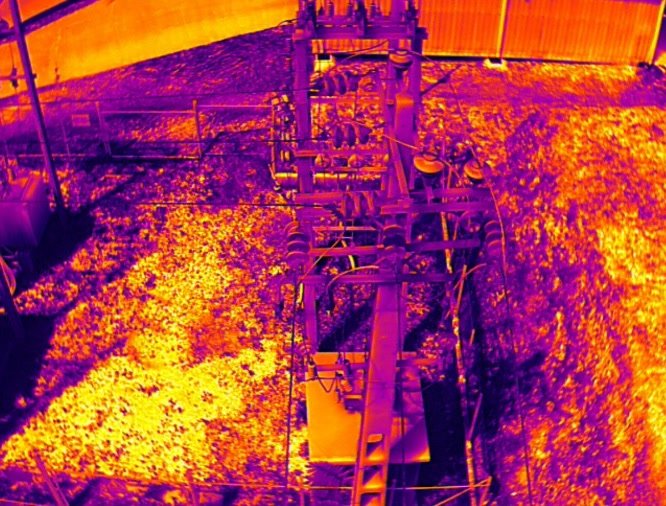
A 33 kV gantry from above. Sun-warmed ground and roofing dominate the frame — separating the asset from its background is part of the read, not an afterthought.
Gantries, transformer yards, towers and overhead lines are slow to inspect from the ground, and the parts most likely to fail are the parts hardest to see — the top of an insulator string, the far side of a bushing, a connector six metres up.
Loose or degraded joints
the single most common finding
Overloaded conductors
heating along a run rather than at a point
Transformer bushings
asymmetry between phases is the tell
Insulators and hardware
contamination, tracking, corroded fittings
Standard: NFPA 70B, which became a standard rather than a recommended practice in its 2023 edition, together with IEC maintenance guidance. Thermographer competence follows ISO 18436-7.
Delivered: the live 33 kV gantry, transformers and switchyard at Piramal Glass, surveyed without an outage. See the project.
A thermal survey is only worth what its report lets you do on Monday morning. Ours is written to be handed to a maintenance planner, an insurer or an auditor without translation.
Thermal and matching visual image side by side, pinned to a plan or orthomosaic of your site, with the measured temperature, the reference temperature and the delta.
Each anomaly classified, with the likely cause and the recommended action and timeframe. Not every hot spot is urgent, and the report says which ones are.
Load, irradiance, ambient temperature, wind and equipment, logged for the survey. Without them a thermal reading cannot be defended or compared later.
Reports are delivered through WRENS, so a repeat survey trends against the baseline instead of starting again. Raw radiometric files remain yours on request.
It is the difference that counts, not the absolute reading — a joint measured against an identical joint on another phase under the same load. Small deltas on critical plant can outrank larger ones elsewhere, which is why grading is done by an engineer rather than a threshold.
Reflections move with the camera and real heat does not, so the same asset is captured from more than one angle. Glass, polished metal and wet surfaces all mislead a thermal camera, and reading around that is most of what the certification is for.
Yes, on request. The radiometric files are yours, and having them means a future engineer can re-measure any point in the survey rather than trusting a screenshot.
It needs enough irradiance for faults to express themselves, which in practice means a clear window around the middle of the day. We will not fly a PV survey in conditions that would produce a clean-looking but meaningless result.
Not in rain, and not in high wind. Cloud is the bigger constraint for solar work than for substations. We schedule around the monsoon and keep a reserve window, which is also why island and resort work is clustered into the drier months.
Annually suits most solar and HV plant, moving to six-monthly on heavily loaded or ageing assets, or where a previous survey found something now being monitored. The interval belongs in the report, set against what we found.
For enclosed switchgear and panel interiors, pair this with ground-based infrared thermography. Where findings point at a protection or loading problem, our ETAP studies pick up from the same report. Resort and island work runs through the Maldives programme, and the wider capability sits under aerial inspection and survey.
A Google Maps pin for the site, and the basics of what we are flying over — for solar PV, the capacity in MW; for a substation, the voltage level and what is in the yard.
Electrical Testing
Infrared Thermography
Electrical Consultancy
Electrical Design
Compliance Monitoring
Other Services
© 2025 Vibhawa Consultants. Site By Remnis Global