
Protection coordination study
When a fault happens, exactly one device should trip: the nearest one upstream. If a device further up operates first, a fault on one feeder takes out the whole plant. If the near device is too slow, a transformer or cable cooks before anything opens. A protection coordination study plots every protective device against every other one, finds where that order breaks, and gives you the settings that fix it.
Miscoordination shows up in two ways, and only one of them is obvious
The wrong breaker trips
A fault on a single motor feeder opens the incomer instead, and the whole board goes dark. Production stops, the maintenance team resets whatever they can find, and nobody learns which device was actually at fault. It happens again three months later.
Nothing trips in time
A relay sits above a transformer's withstand curve over part of the fault range. For those currents the transformer takes more heat than its windings can survive while the relay is still counting. Nobody sees a symptom until the day it fails — and then it reads as end of life, not as a setting that was wrong for years.
Both are settings problems, not equipment problems. The devices are usually fine. What is wrong is the relationship between them — and that relationship only becomes visible when every curve is plotted on one sheet.
What a coordination engineer sees
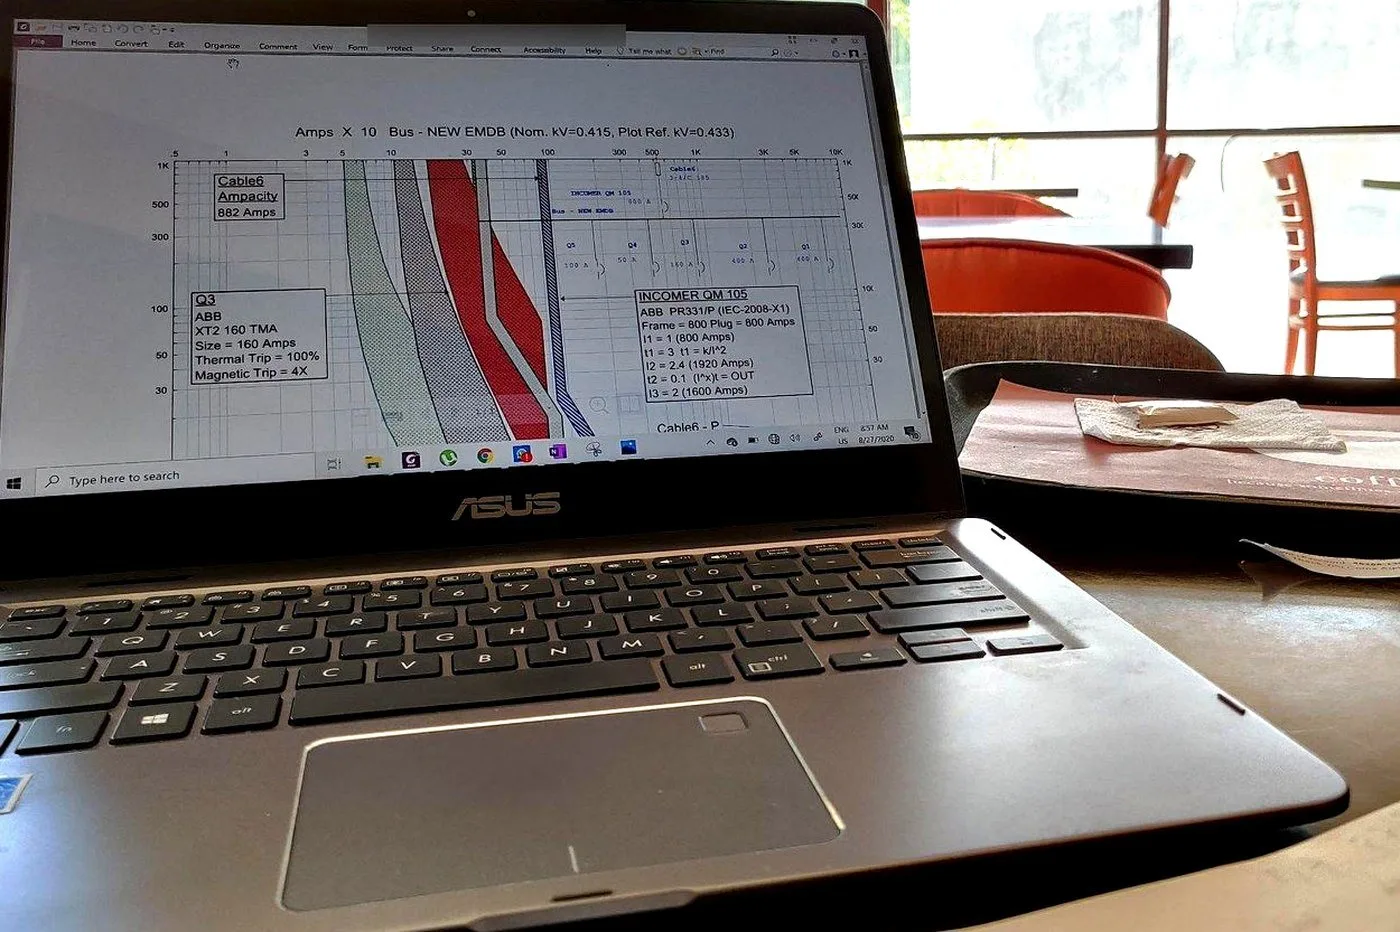
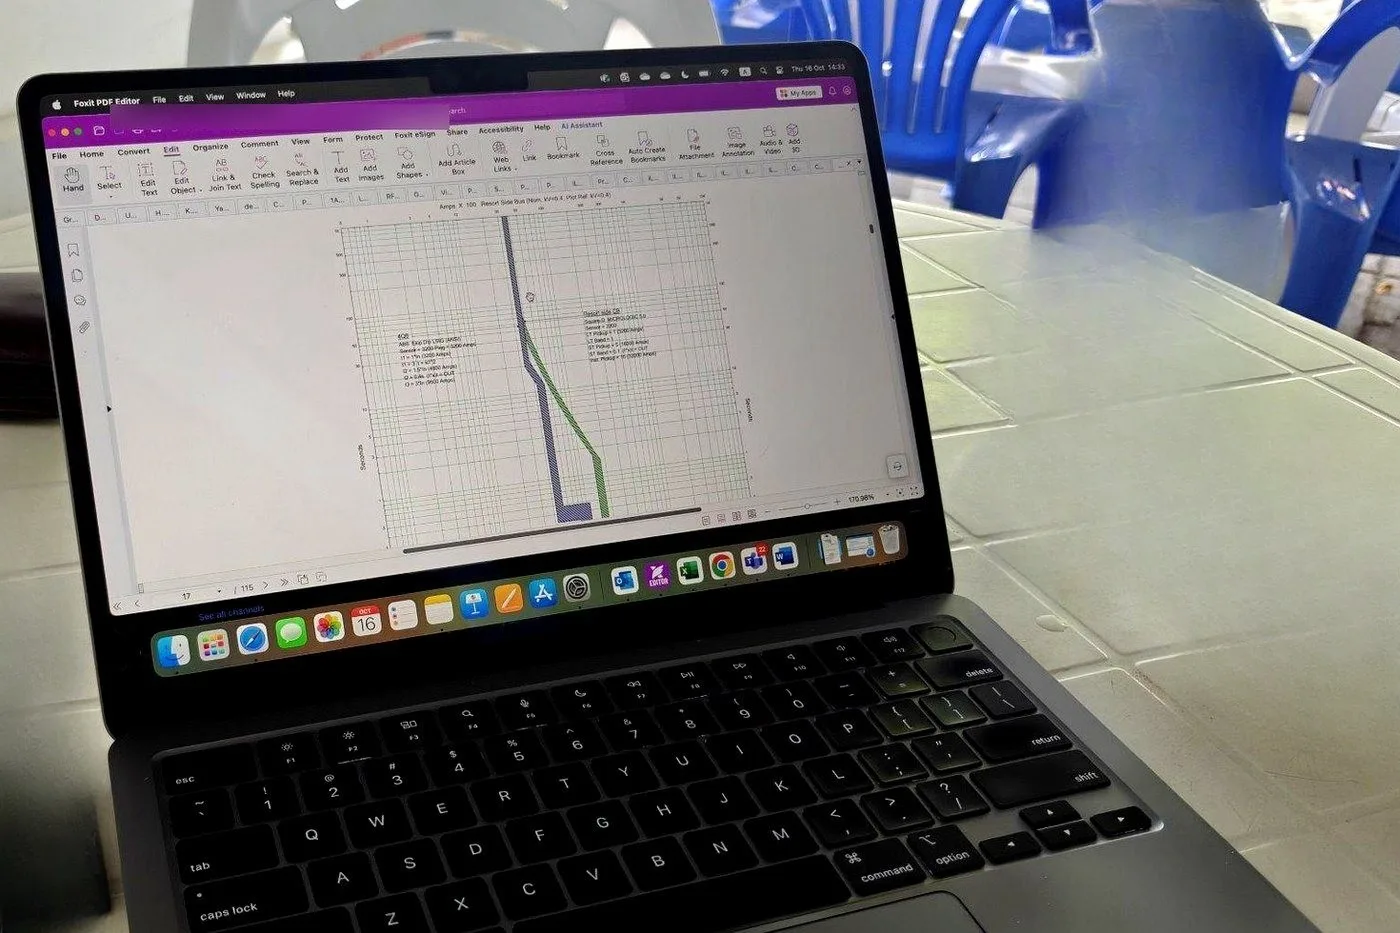
Two time–current plots exported from ETAP, with client details removed. Current runs left to right, tripping time bottom to top. For the system to be protected, each curve has to sit clear of the one it backs up — and below the damage curve of whatever it protects — across the whole range.
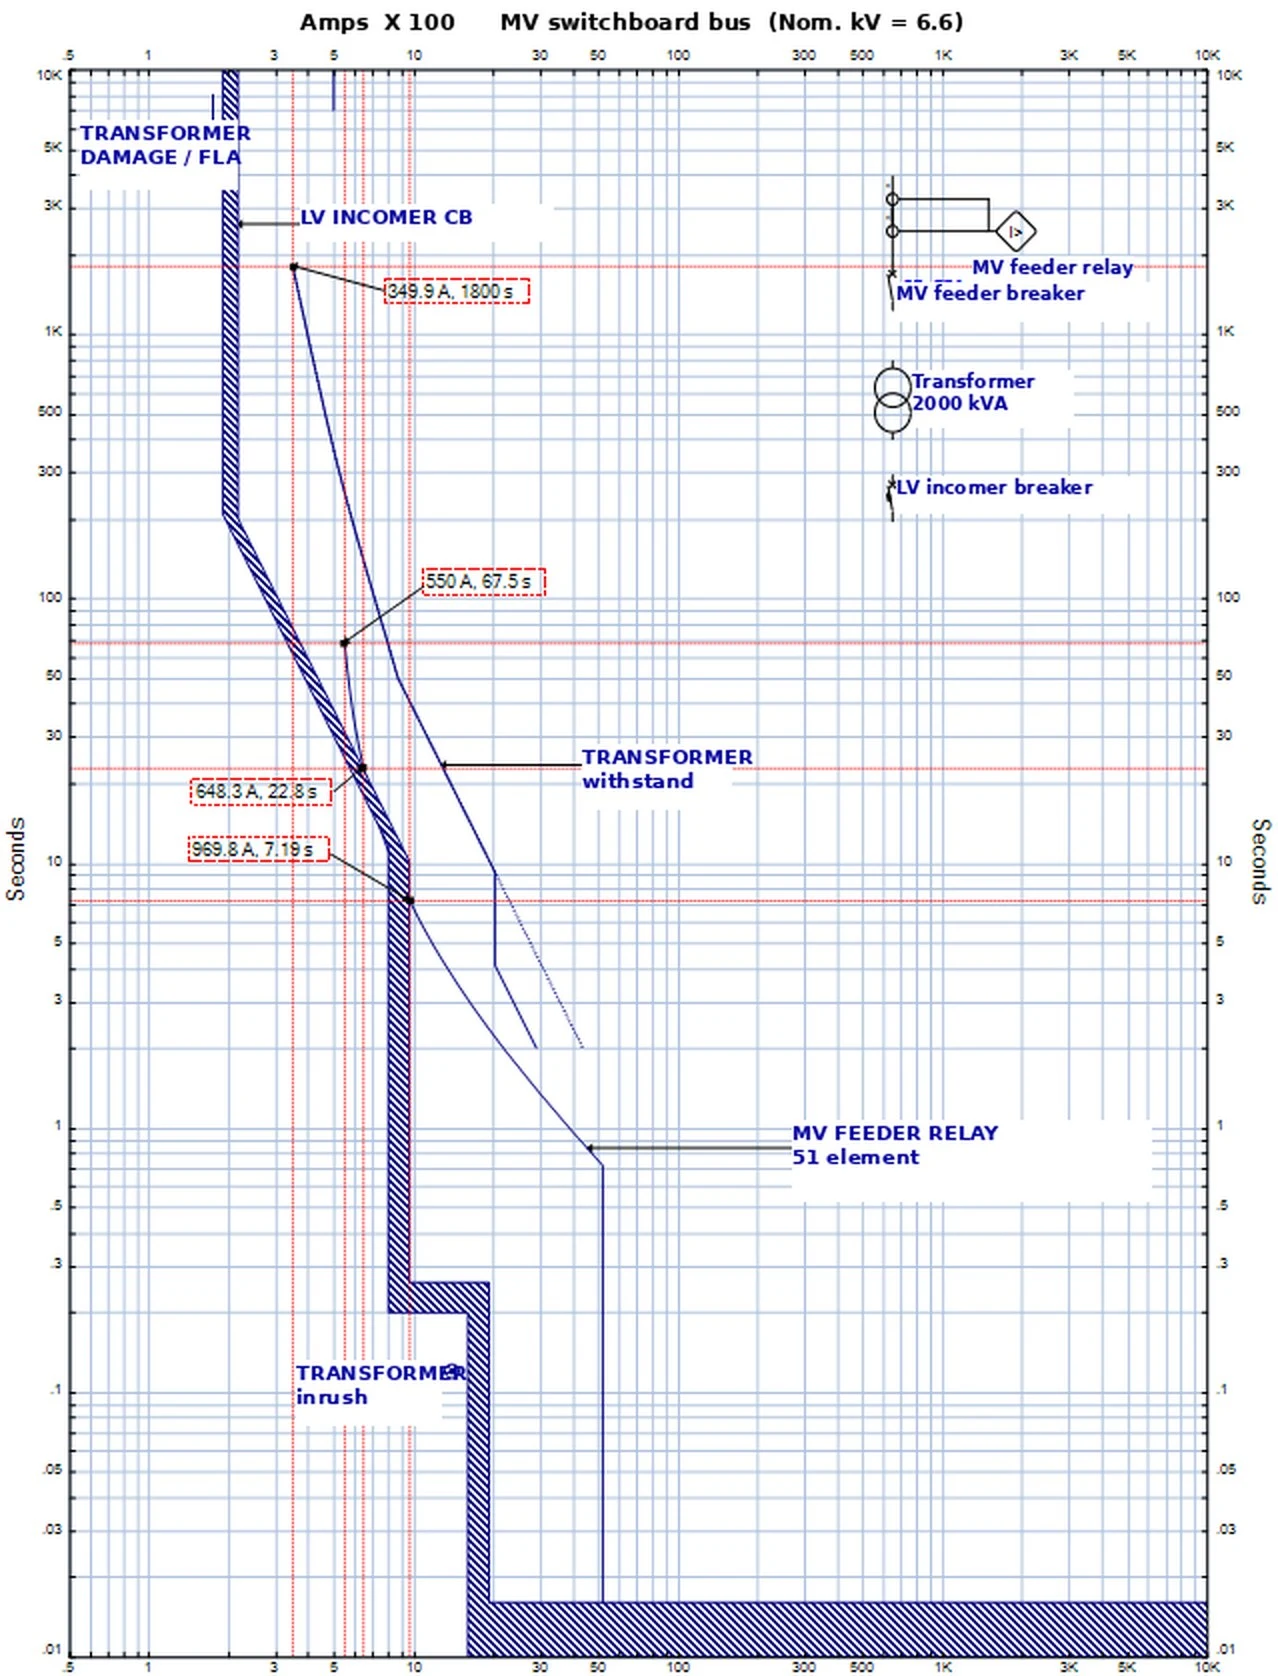
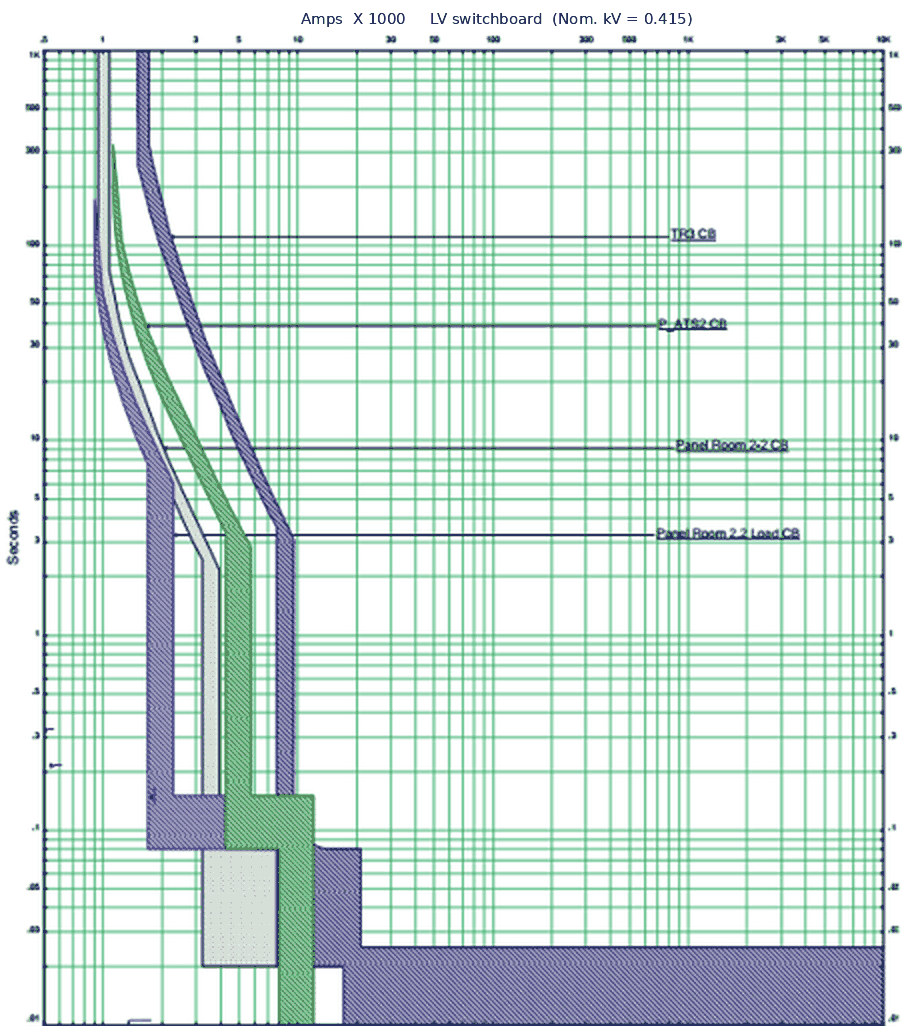
On a recent study of a 22 kV cement plant stepping down to 6.6 kV and 415 V — INSEE's Thi Vai plant in Vietnam — eight device pairs failed to grade on the settings the plant had been running, including the one plotted above. All eight were corrected in the proposed schedule, with the sequence of operation re-simulated at every bus to prove the new order holds.
What the study covers
Coordination needs fault currents to grade against, so the short circuit analysis is inside the scope. Commissioned with an arc flash study, both run on one model.
What you receive
| Deliverable | What it contains |
|---|---|
| Study report | Executive summary, input data and assumptions, stated limitations, load flow, short circuit, coordination findings, sequence of operation and ranked recommendations — signed by a Chartered Electrical Engineer. |
| Settings schedule | One row per protective element: CT ratio, curve, pickup in per-unit and primary amps, time multiplier, instantaneous pickup and delay — formatted to be worked through device by device during a shutdown. |
| TCC curve set | Existing and proposed curves for every graded pair, annotated at the crossing points. The before set is what you show the board; the after set is what you keep on file. |
| Marked single-line diagrams | The modelled network with load flow, short circuit and device data on the drawing, as a working reference. |
| The ETAP model | Available on request. If you extend the plant next year, the next study starts from a verified model instead of from scratch. |
What we need to start
Incomplete records are the norm. Send what you have.
- Single-line diagrams, at whatever revision you hold
- Transformer nameplates — rating, impedance, vector group, tap range
- Protective device list: relay make and model, CT and VT ratios, and the settings currently applied
- Circuit breaker ratings and trip unit types
- Cable sizes, types and lengths for the main runs
- Motor ratings for anything large enough to matter to the grading
- The utility fault level at your incoming connection — your distributor will provide it on request
No site visit required. The study is built entirely from this data — no mobilisation, no travel cost, no disruption on your floor, and no reason a plant in Melbourne, Malé or Doha is harder to serve than one in Colombo. Where a record is missing we tell you exactly which value to read, and where on the equipment.
Four markets, four reasons it gets asked for
Plants grown feeder by feeder
Settings inherited from whoever commissioned each board over twenty years. The trigger is usually a nuisance trip that took the line down, or a group HSE audit from a multinational parent.
Islands on their own generation
A protection failure is not an inconvenience but a dark island with guests on it. Grading across generator sets, changeover and distribution is the whole question.
Our Maldives work →Commissioned with arc flash
Clearing time drives incident energy, so the two are solved together — with the arc flash side worked to ENA NENS 09 where your network operator requires it.
Industrial plants, delivered remotely
Cement, process and utility networks studied entirely from data — as at INSEE's Thi Vai plant in Vietnam — on the same terms and turnaround as Colombo.

A maintained ETAP seat since 2020
Licensed since 2020, currently on ETAP 24.0.3 — licence certificate available on request with any proposal. A maintained seat tracks the standard revisions and keeps its device library current, which is why the arc flash work alongside these studies is to IEEE 1584-2018.
The software is the cheapest part of a study. What takes the time is building a model from drawings that no longer match the plant, getting the fault level out of the utility, deciding which grading margin is defensible where the standard leaves room, and knowing which of the eight problems you found is the one that will cause an outage. The report carries a Chartered Electrical Engineer's signature — the part an insurer, an auditor or a parent company's HSE function is looking for.
What it is worked to
Frequently asked
What is a protection coordination study?
An engineering study that plots the time–current characteristics of every relay, breaker and fuse in a network against each other and against the damage curves of the equipment they protect, so that the device nearest a fault always trips first. It produces a settings schedule for every protective device. It is also called a relay coordination study or protection grading study.
How long does it take?
Two to four weeks from complete data for a large industrial facility, depending on the size of the network. A single substation or a small resort island is faster. The clock starts when the data is complete, which is why we tell you early exactly what is missing.
Do you need to visit the site?
No. The study is built from drawings, nameplate data and your existing settings, which makes it practical to deliver to the Maldives, Australia, Vietnam or the Middle East at the same price as Colombo.
Can you apply the settings for us?
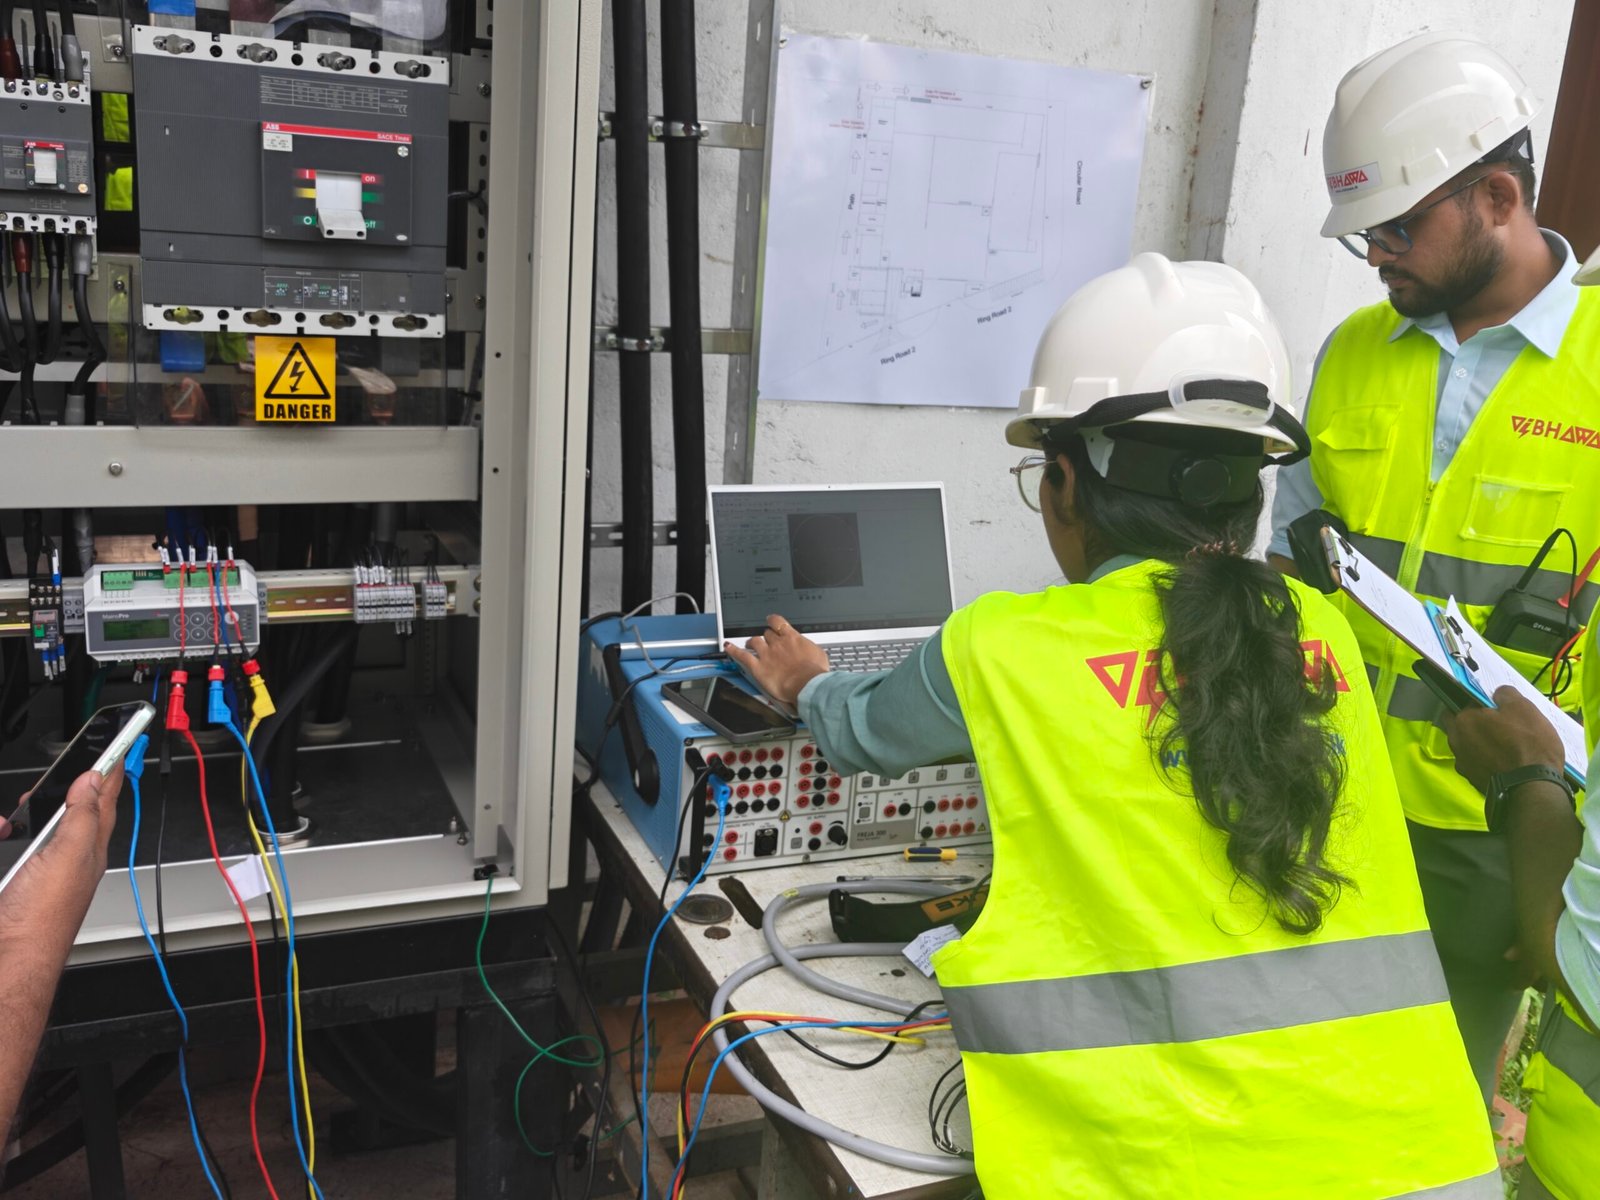
Applying settings is live work on your switchgear and belongs with the team that owns that equipment. The schedule is written to be worked through device by device during a shutdown, and we are available to your engineers while they do it. Where you want the relays tested afterwards, our protection system testing team can do it.
When should it be redone?
Whenever the network changes materially — a new transformer or feeder, a replaced relay, a generator added, or a change in the utility fault level at your incomer. Otherwise a five-year review is the usual cycle.
Do we need this if we are already doing an arc flash study?
It is already in it. Incident energy depends on how fast the upstream device clears, so the arc flash result is only as good as the coordination behind it. Commissioned together they share one model and one set of fault currents.
Send us the single-line diagram
That one drawing is usually enough to scope the study and quote it. If you also know your utility fault level, we can tell you on the first call whether there is likely to be a grading problem worth finding.


